Product reaction per year
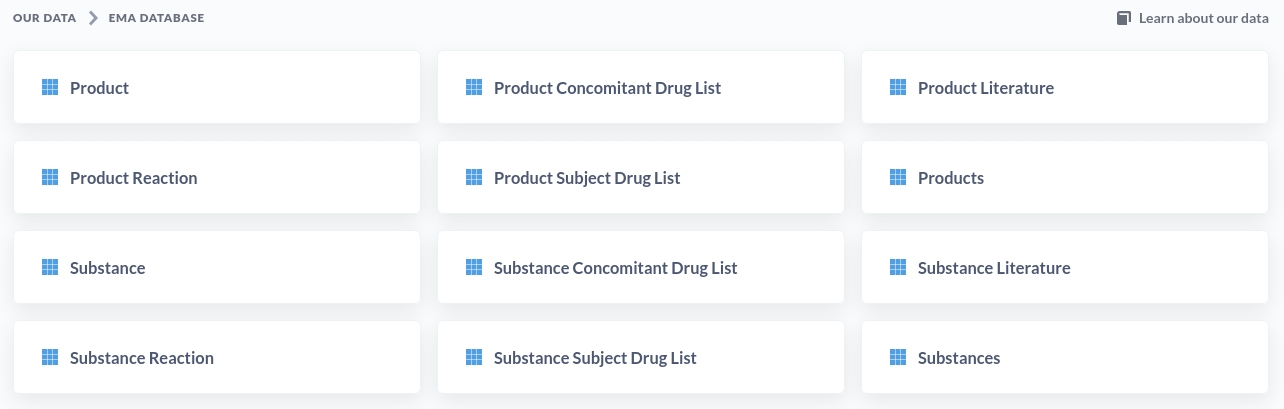
In Metabase, select the EMA database from the Home page clicking the link.

You will be taken to a page that shows all the tables in the database.
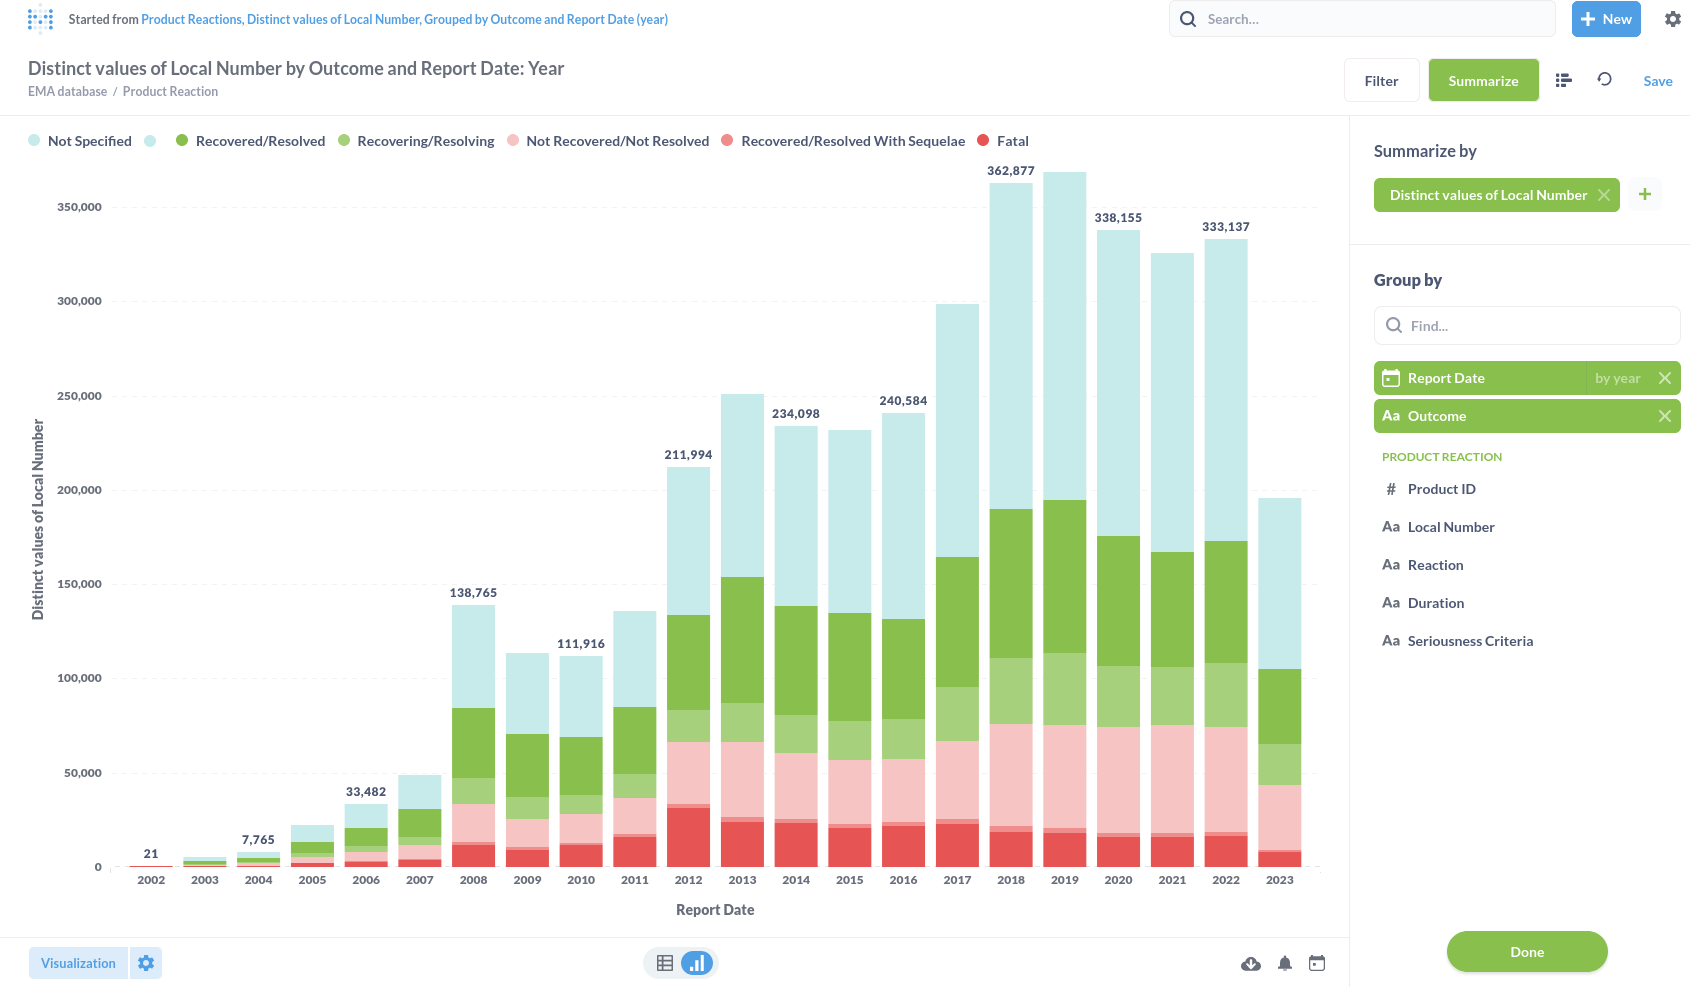
We created the following visualisation where we:
- Summarized by Distinct values of Local Number
- Grouped by Outcome
- Aggregated the Report date by year
The screenshot shows the result, we challenge you to create a similar presentation.
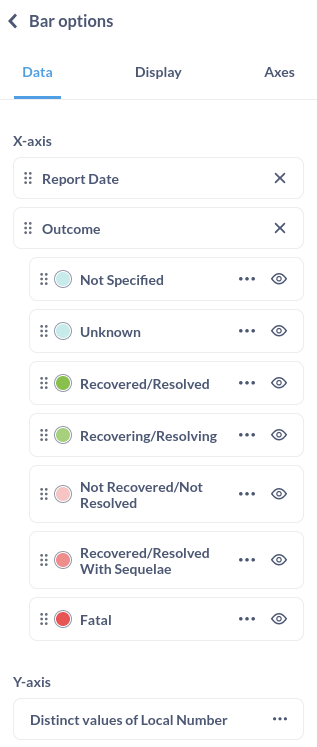
We changed the sequence of the results and changed the colors for the bars in the left panel.
Did you manage to get the same presentation? Let's look at it in detail and draw example conclusions.
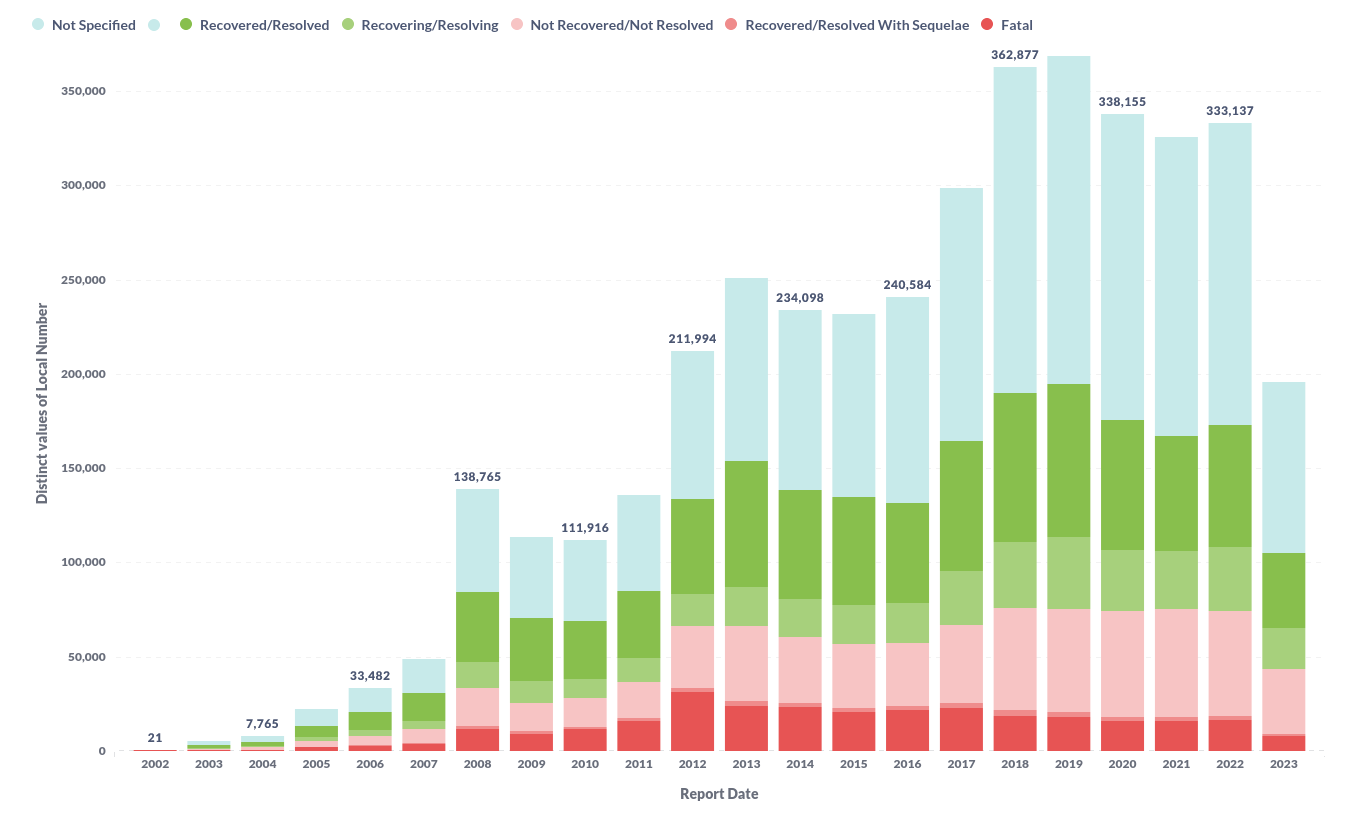
A couple of things we notice:
- The number of reports on product with a Fatal outcome seems to be stable or even decline a little.
- The number of reports on product that have an unspecified or unset outcome has been rising and kept rising until 2020 to drop a little from there.
- The number of reports on product is declining since 2020
- The number of reports on product with outcome Recovering/Resolving and Recovered/Resolved has been rising, but is declining since 2020.
Can you think of more advanced uses? We welcome discussion and suggestions, also about misinterpretation. Let us know!