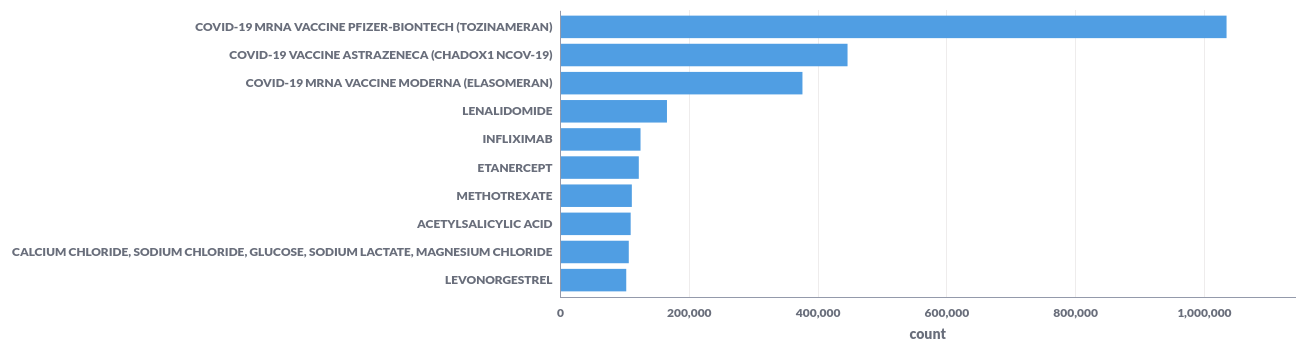
Substance top-10
In Metabase, select the EMA database from the Home page clicking the link.

You will be taken to a page that shows all the tables in the database.
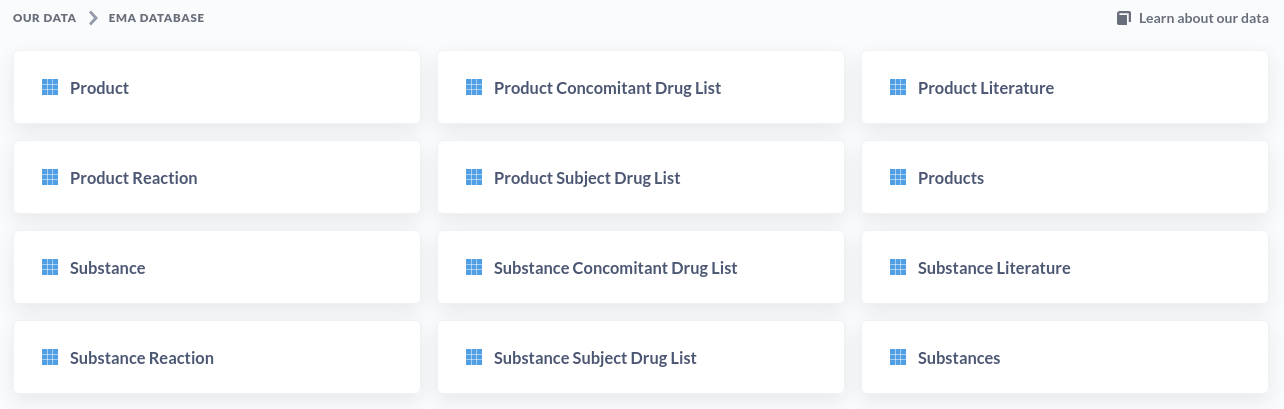
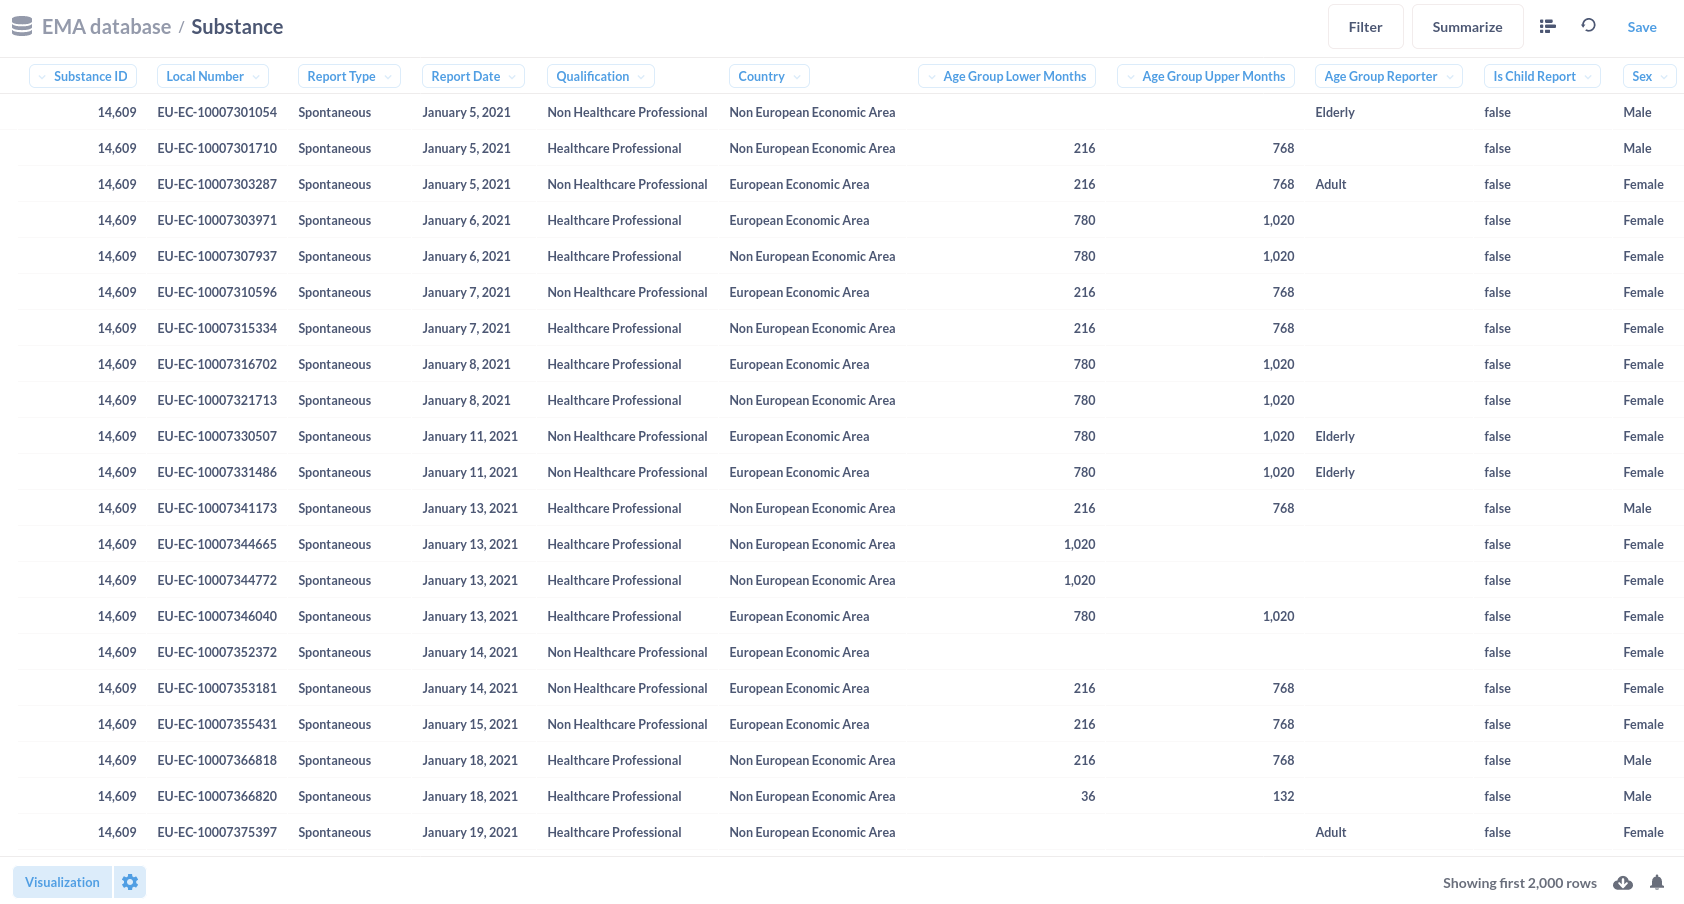
Click the Substance button. You should now see the Substance table.
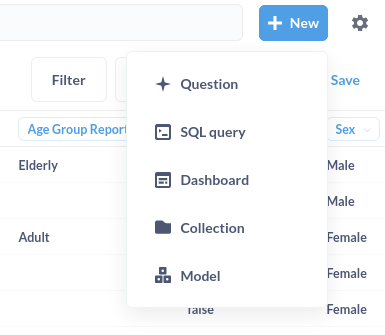
We press the + New button in the top right of the screen and select SQL query.
And end up with a blank sheet
![]()
In the input area of the page, we enter the query that we find at analyses - substances - substance top-10
And press the blue play button in the lower right corner.
A screen appears showing that the data is being loaded (doing science).

When the query finishes running, your screen should show the query in the top section and a table in the bottom section like in the next screenshot.
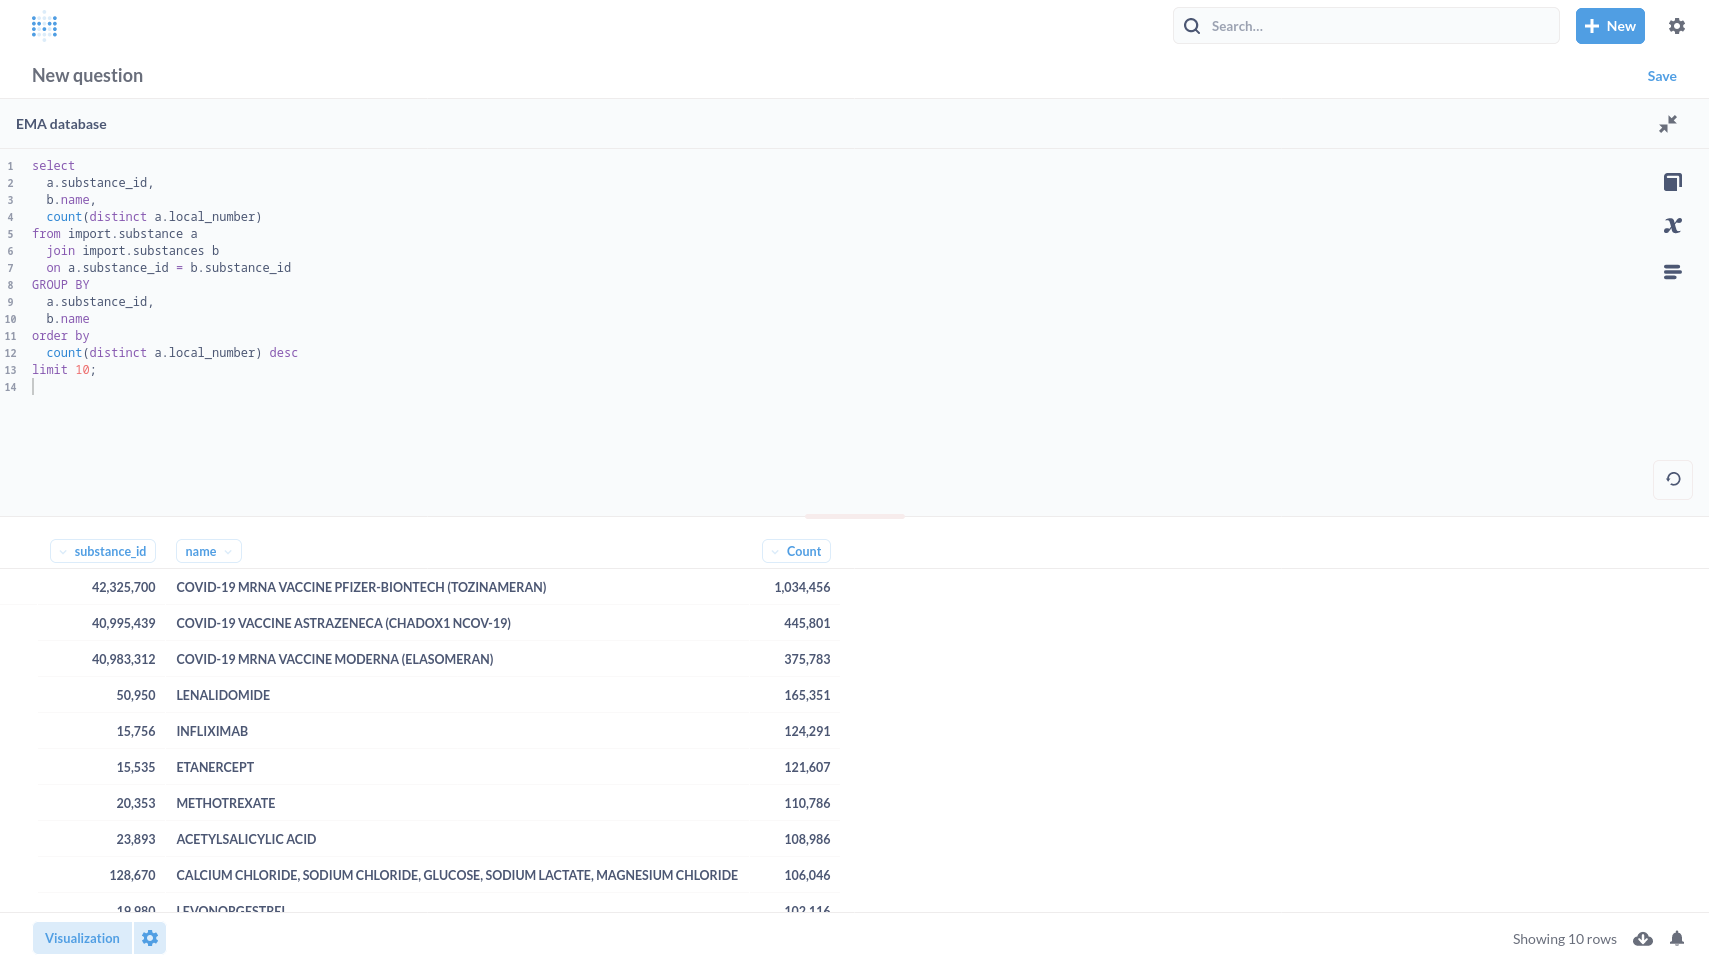
You can now select the Visualization button that opens a side panel.
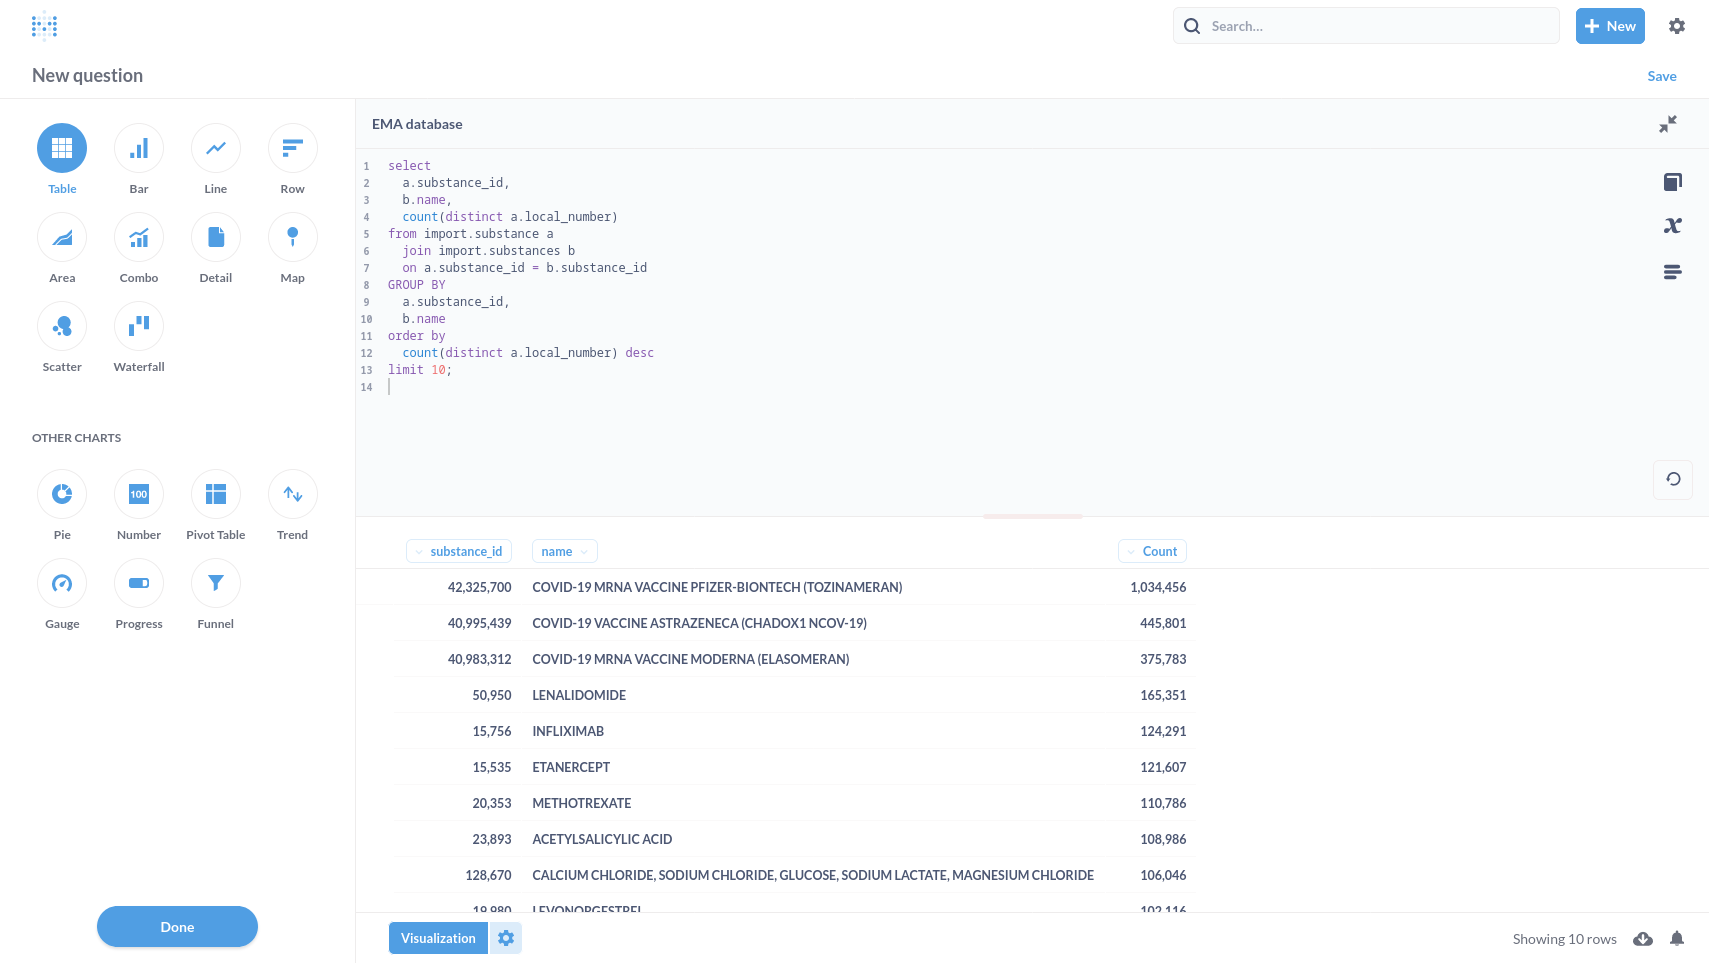
Select the Row visualisation to get the picture shown below.
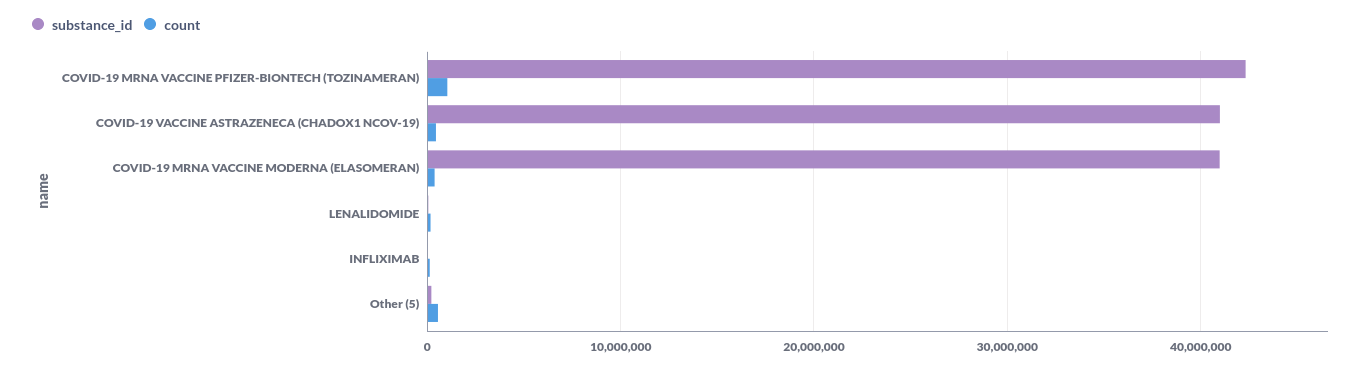
If you hover your mouse over the now selected Row button, you will see a cog symbol appear. Click it. A new side panel opens with Row options
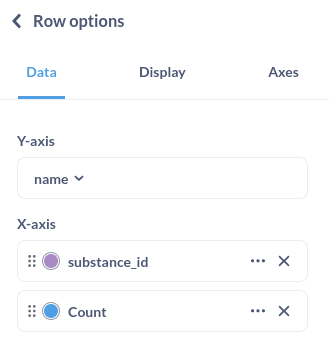
Remove the substance_id from the X-axis
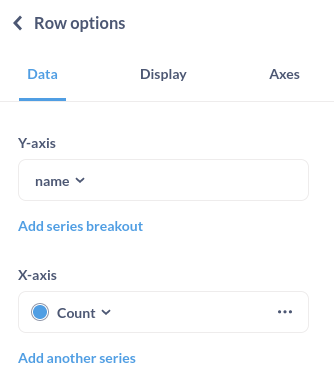
You will see the visualisation change, now showing the substance top-10 in a horizontal row chart.