Substance reaction per month
In Metabase, select the EMA database from the Home page clicking the link.

You will be taken to a page that shows all the tables in the database.
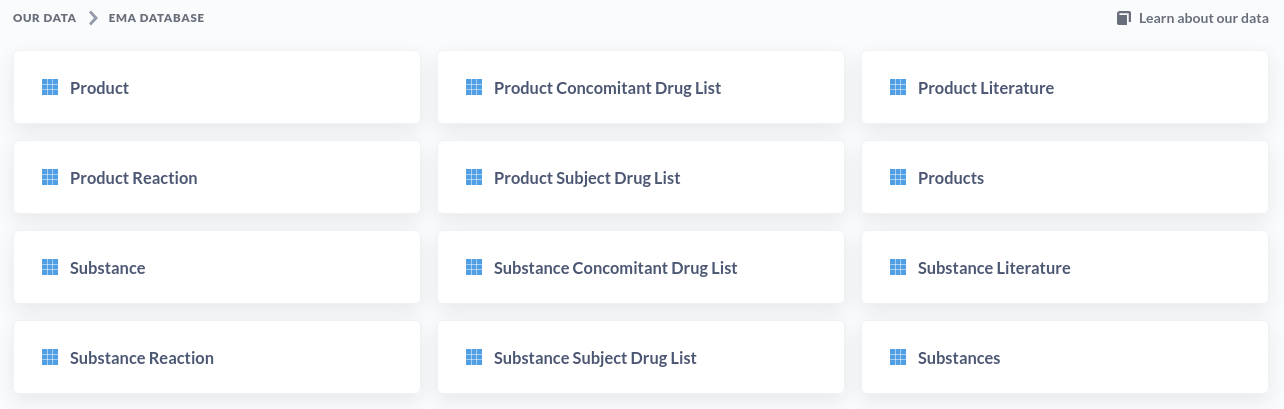
Click the Substance Reaction button. You should now see the substance_reaction table.
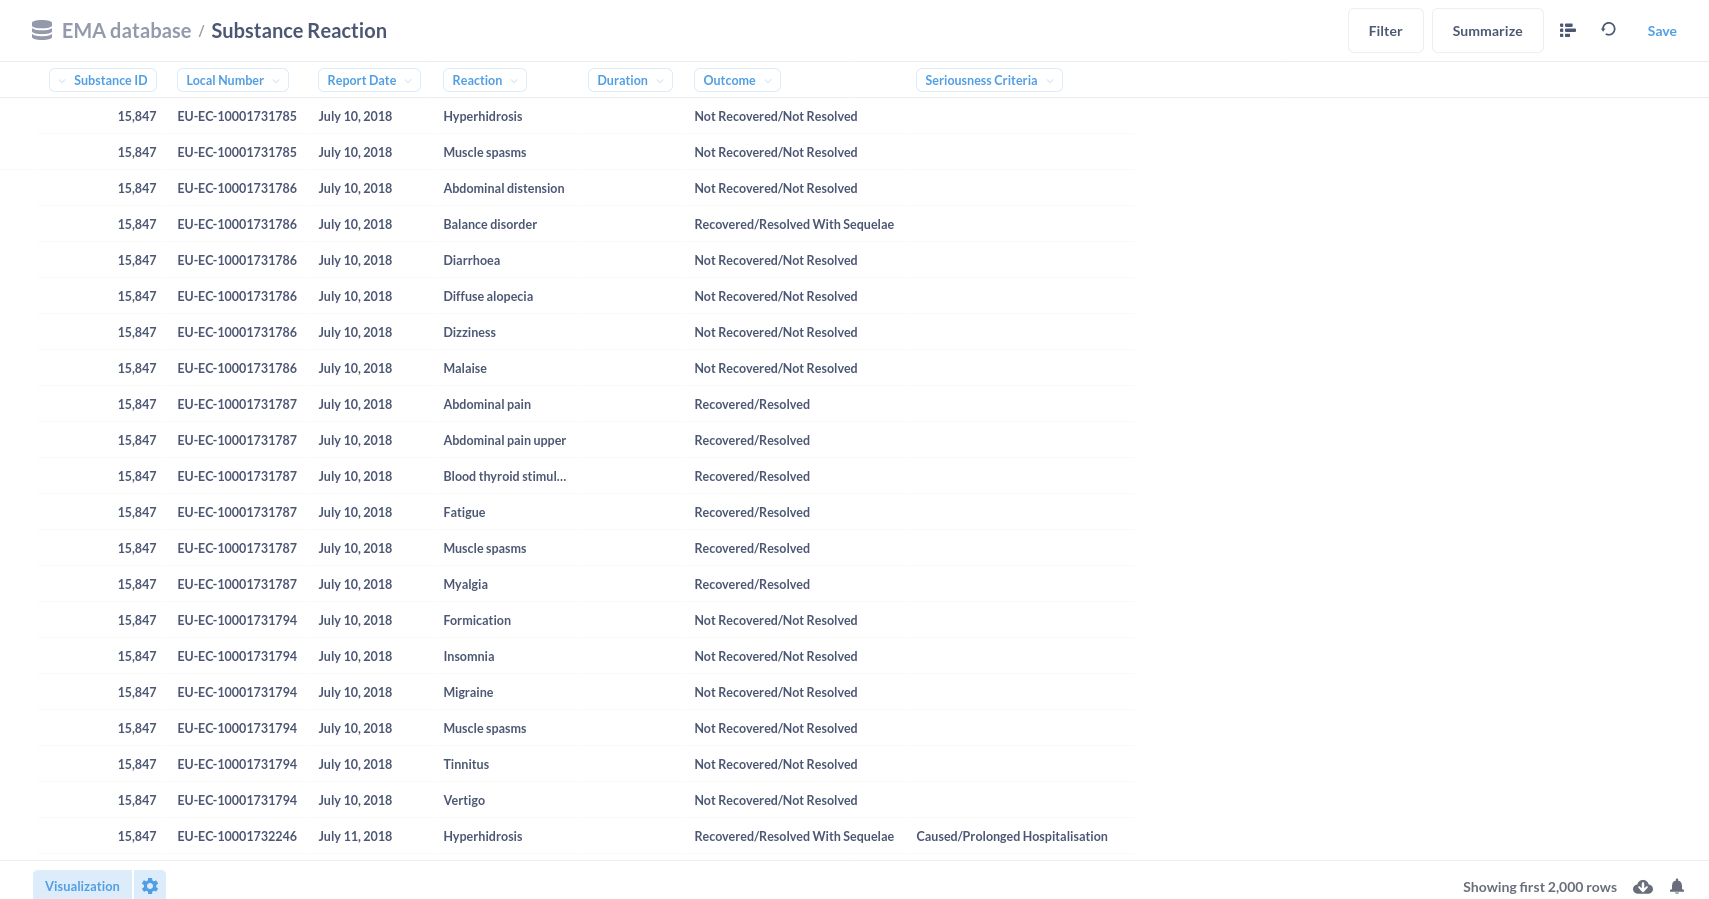
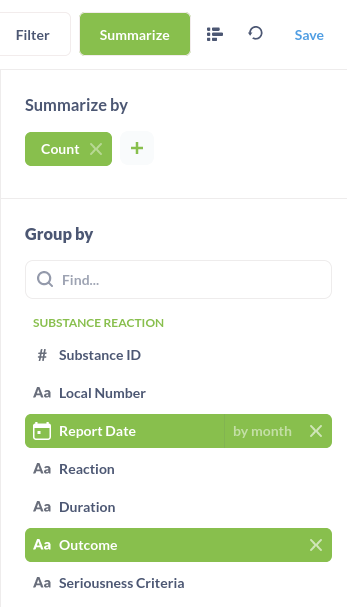
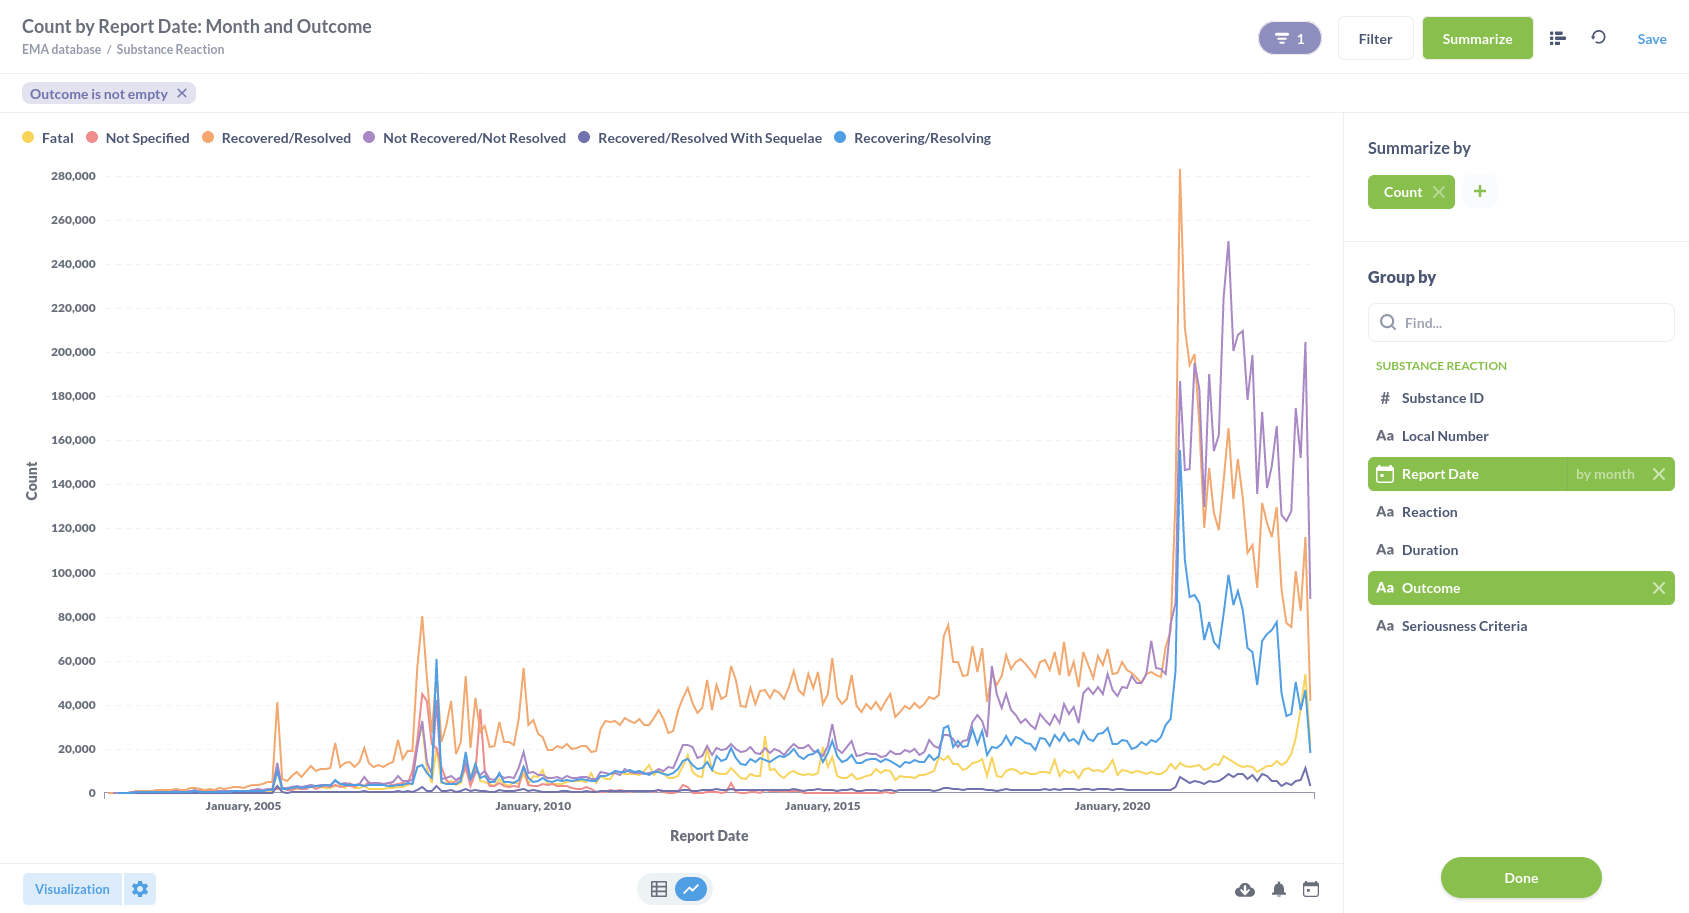
Press the Summarize button in the top right corner. In the side panel that opens, Make sure that it the Count button is green. Hover over the report data and change the value by day to by month. Now hover over Outcome to see a + appear to add grouping. Click it.
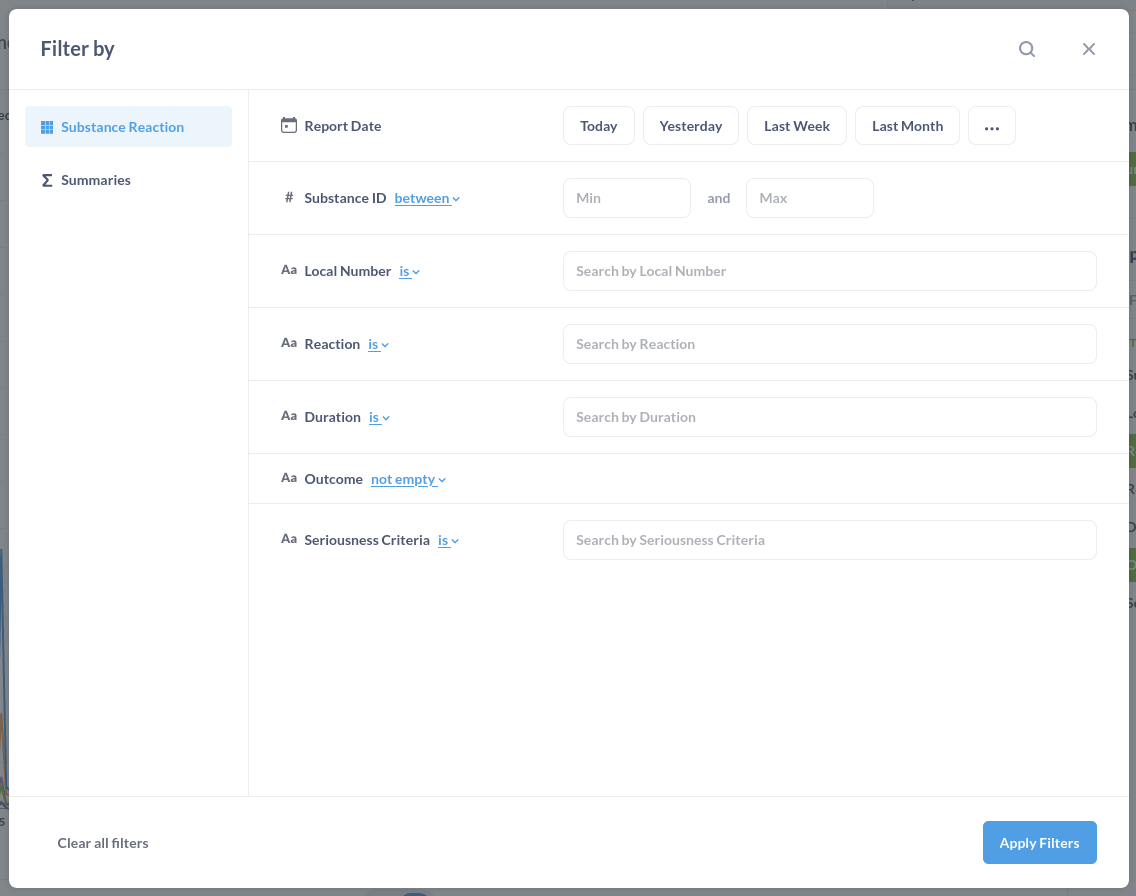
We need a filter, to hide the line with the empty outcome. Press Filter in the top right. A screen will pop up where we will select "Outcome Not empty" as shown in the next screenshot. When done, press Apply Filters
After Metabase retrieves the results from the database, the display should look like the next screenshot.
Metabase offers a variety of options to tweak the visualisation. We replaced COUNT with Distinct values of Local Number which takes a while to render but makes sure only one instance of each report version is used in the visualisation. Since a lot of reports are connected to multiple substances, the Y-axis maximum value changes from 280000 to 90000. Make sure you use distinct reports in your visualisations too!
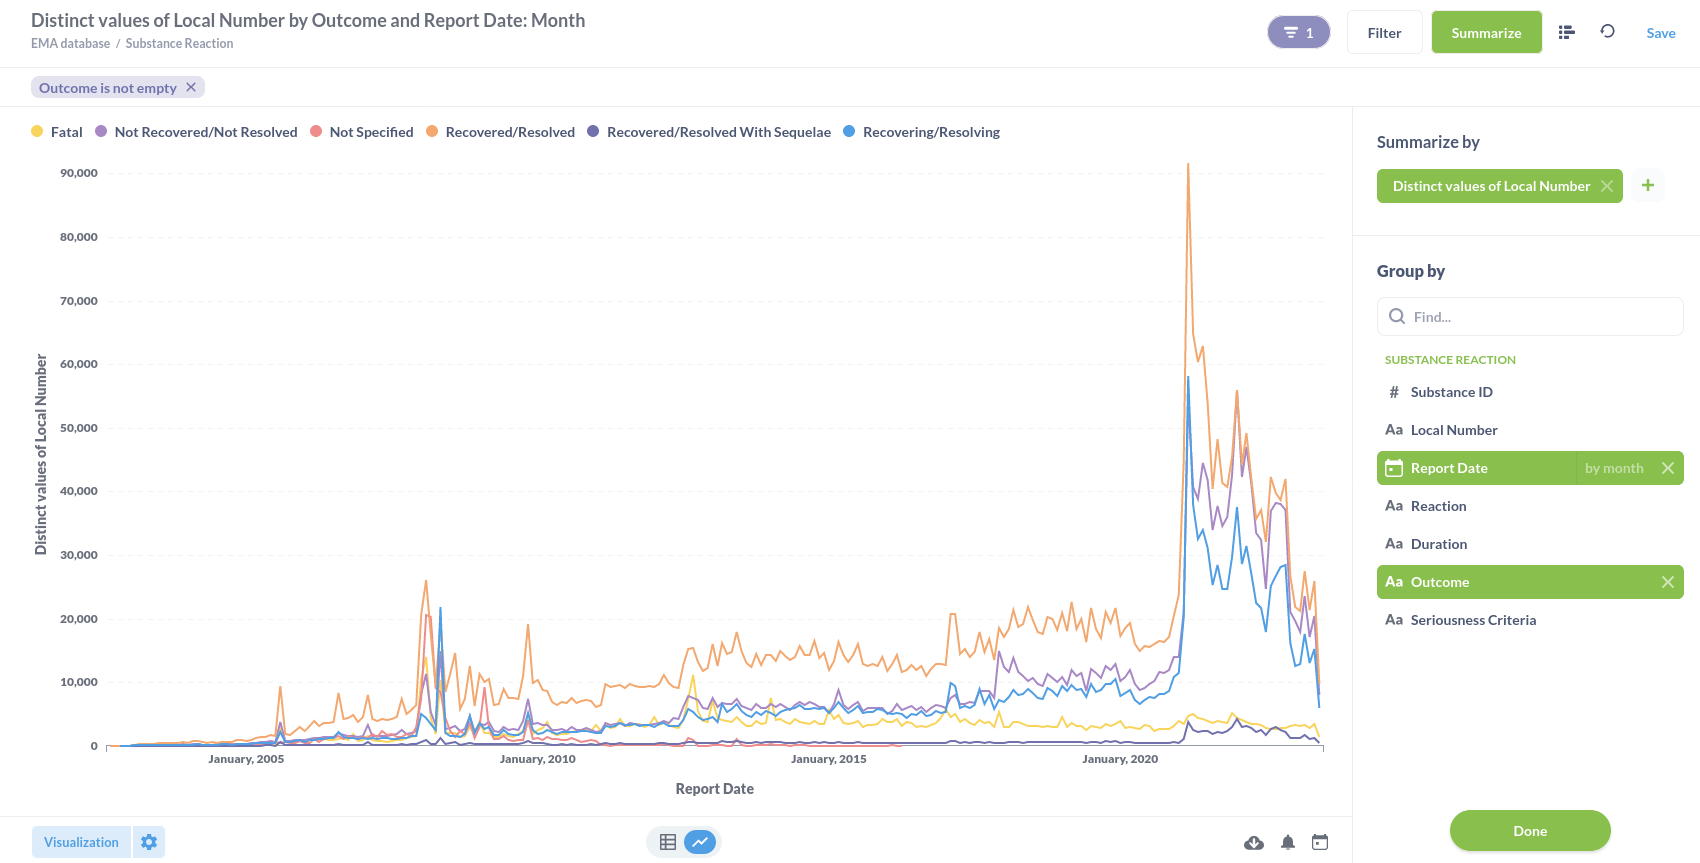
We notice a sharp increase sometime after the start 2020. When we zoom in to January 2020 to July 2023, we get a more detailed view of what is happening.
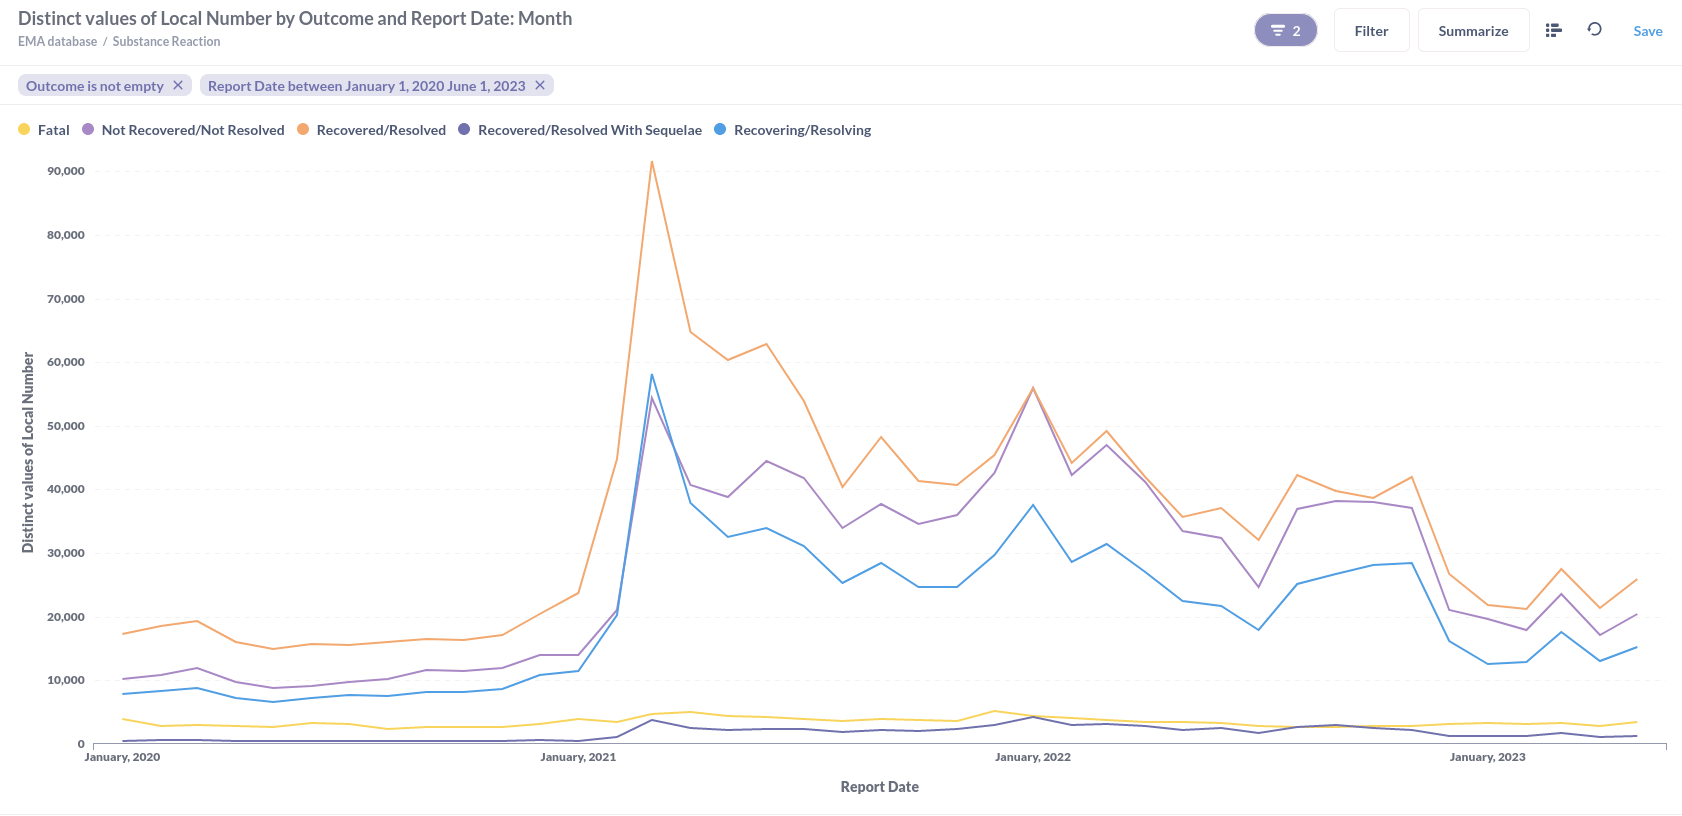
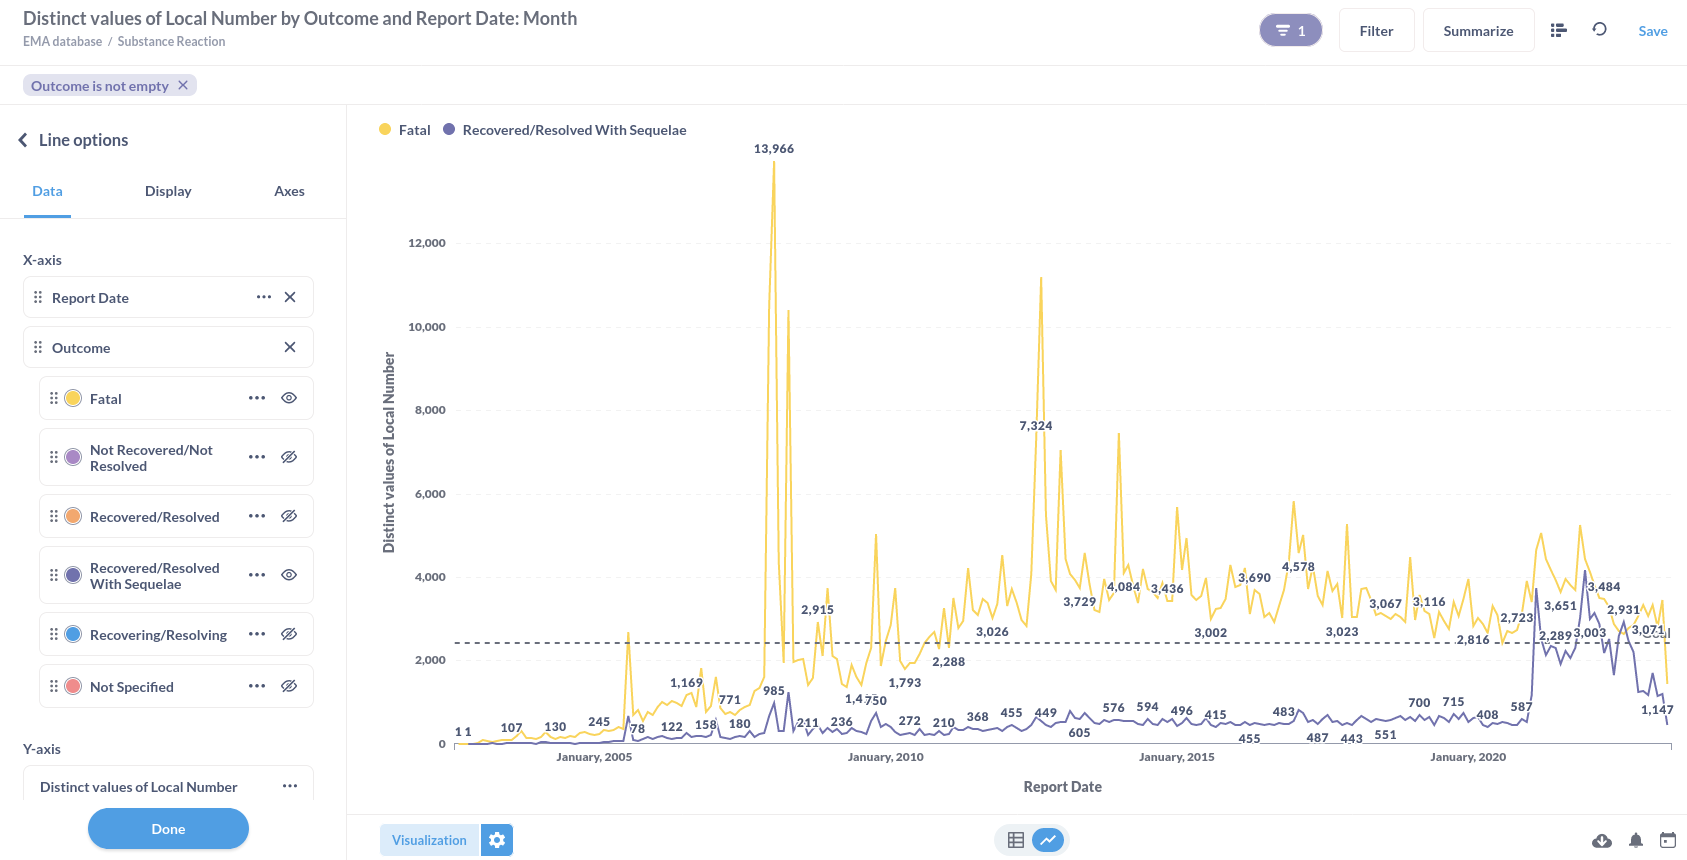
In the zoomed in picture, we can see that from January 2021, the total number of reports explodes and then slowly decreases, but the number of reports that result in Fatal and Recovered/Resolved With Sequelae differ in the hundreds which make their line appear flat. Let's isolate these two lines by turning the others off. This can be done from the left side panel that opens when we press the Visualization button and select the Cog symbol in the upper right corner of on the Line Graph button that appears when we hover that button.
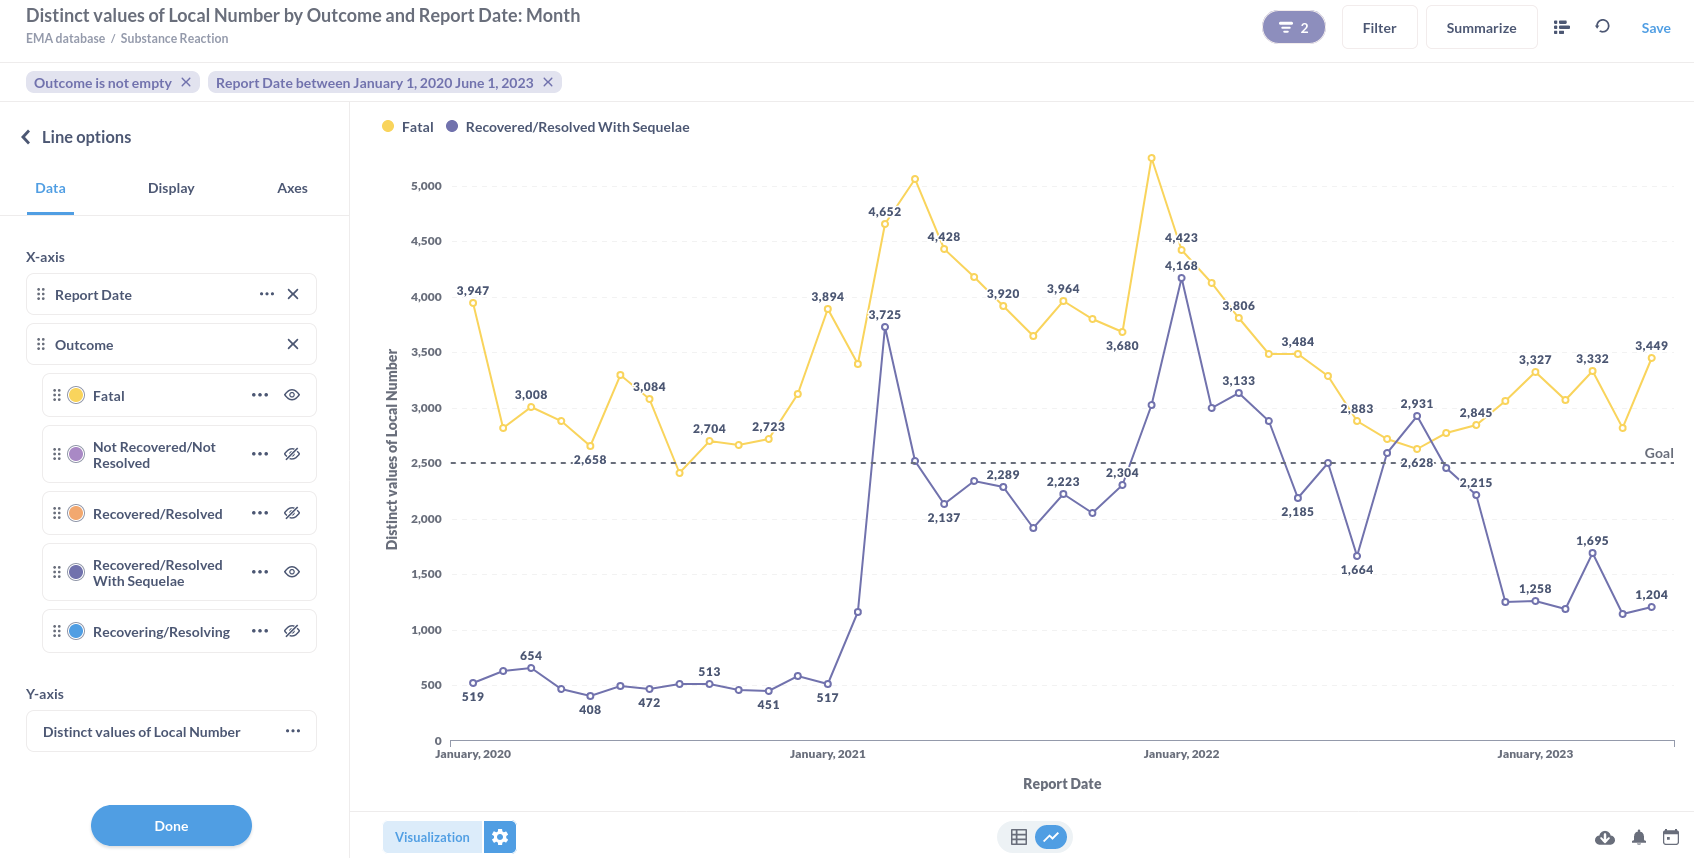
The number of reports with Fatal outcome fluctuate, but stay above 2417 for this period in time. If we take the whole period of the database, we see two peak periods in reports with Fatal outcome; February to June 2008 and September 2012 to January 2012. We can also see that after February 2011 the reports with Fatal outcome no longer drop below 2417 until the end of the total dataset.
We strongly encourage everyone to create their own visualisation and describe their choices so results can be reproduced and discussed.